ICHIMOKU Crypto Swing StrategyThis is a crypto swing strategy designed for timeframes bigger than 1h.
The main components are
ICHOMOKU
KDJ
Average High
Average Low
Rules for entry
For long: we have the ichimoku crosses between tenkan and baselines, we have a rising kdj line and at the same time we have a increase in the average high
For short: we have the ichimoku crosses between tenkan and baselines, we have a falling kdj line and at the same time we have an increase in the average low
Rules for exit
We exit when we have inverse conditions than the initial ones used for entry.
Caution
This strategy does not use a risk management, so be careful with it !
If you have any questions let me know !
Pesquisar nos scripts por "high low"

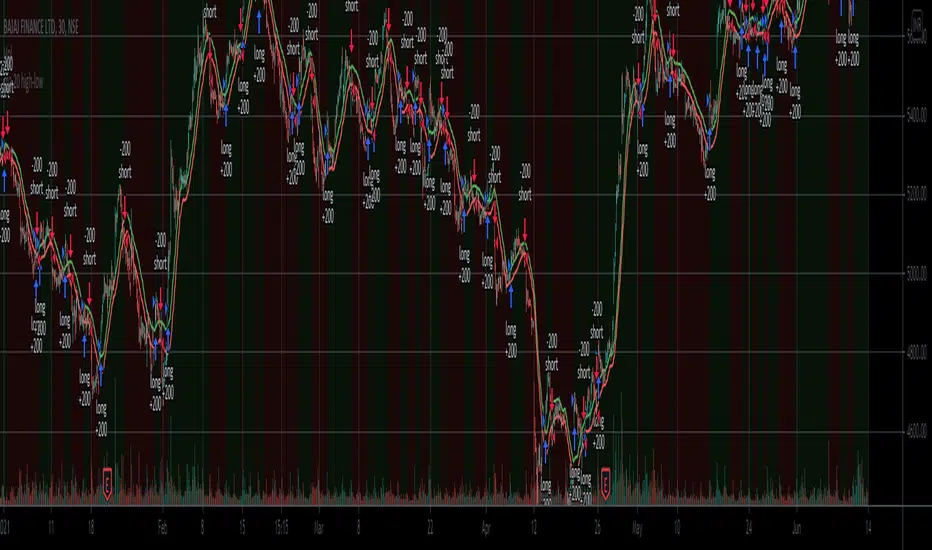
ma 20 high-lowThis is a simple 20-period high and low SMA strategy. We buy the stock when it closes above the 20 period SMA of high prices and sell when it closes below it. We sell when the price closes below 20 period SMA of low prices. This strategy works phenomenally well for a few stocks examples are bajaj finance and bajaj finserv. I want to see if it makes a good return in future. It works well for 30 mins and a daily time frame.
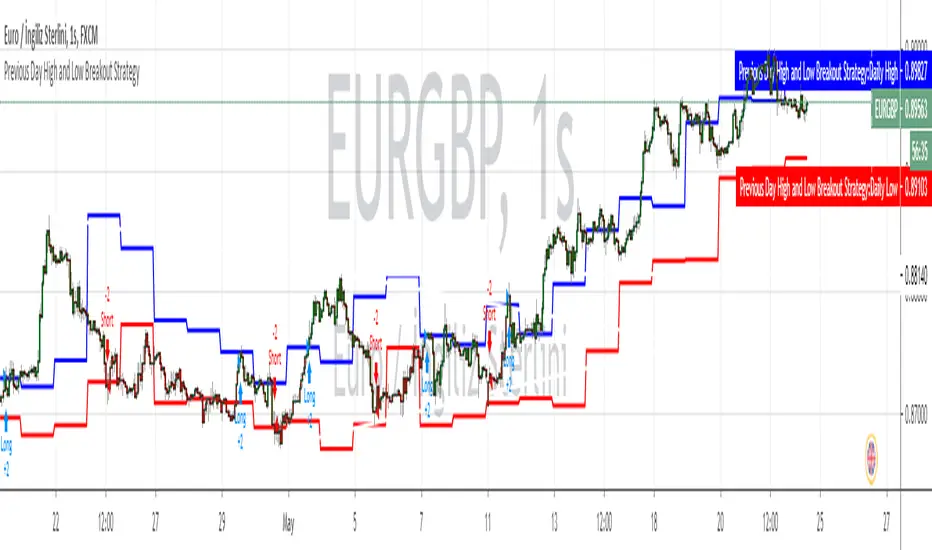
HiLo Extension This Strategy is finding high and low breaks of the day and enter into the trader based on RSI value and time value
1) This strategy is created for Indian Index like Nifty, Bank Nifty and so...
2) Trades are initiate only after 10:15 AM and before 3:10PM
3) High and Low of the day break will be check during the above time frame
4) RSI value will be check (RSI 50)
5) and trade will be initiate
6) Stop loss set as vwma 20...
Note: This Script will work fine in Index future chart not index spot chart...
This is just my idea only... Please back test yourselve, before using it..
Your comments are welcome!

inwCoin Sto RSI Bullish/Bearish Divergence StrategyinwCoin Stochastic RSI Bullish / Bearish Divergence Strategy
This strategy is an alternated version of inwCoin RSI Bull/Bear div Strategy.
Because I want to know if the popular "STO RSI Divergence" Strategy really work in real trade?
The good thing about Sto RSI that it can provide us with more entry data for both long and short.
Because sometime RSI will never go to OB or OS zone again..
But sto will keep swinging between OB and OS zone.
Entry Condition
=============
BUY = Smooth K is higher low + price is lower low
SELL = Smooth K is lower high + price is higher high
Other Parameters
===============
- Use stop loss + stop loss %
- Data source for high/low price check
- Lookback period for divergence
Conclusion
==========
This strategy is working great for short entry when market is in sideway down.
Like in 1/7/2019 - 1/1/2020
or 1/1/2018-1/1/2019
But your portfolio will go kaboom if you short in the uptrend....
Also, this is not the good strategy for trend following + long position
But it's great addition if you want to pyramid your position in uptrend.
or looking for good spot to entry long if you miss the uptrend bus.

Combo Backtest 123 Reversal & Chaikin Volatility This is combo strategies for get a cumulative signal.
First strategy
This System was created from the Book "How I Tripled My Money In The
Futures Market" by Ulf Jensen, Page 183. This is reverse type of strategies.
The strategy buys at market, if close price is higher than the previous close
during 2 days and the meaning of 9-days Stochastic Slow Oscillator is lower than 50.
The strategy sells at market, if close price is lower than the previous close price
during 2 days and the meaning of 9-days Stochastic Fast Oscillator is higher than 50.
Second strategy
Chaikin's Volatility indicator compares the spread between a security's
high and low prices. It quantifies volatility as a widening of the range
between the high and the low price.
You can use in the xPrice1 and xPrice2 any series: Open, High, Low, Close, HL2,
HLC3, OHLC4 and ect...
WARNING:
- For purpose educate only
- This script to change bars colors.

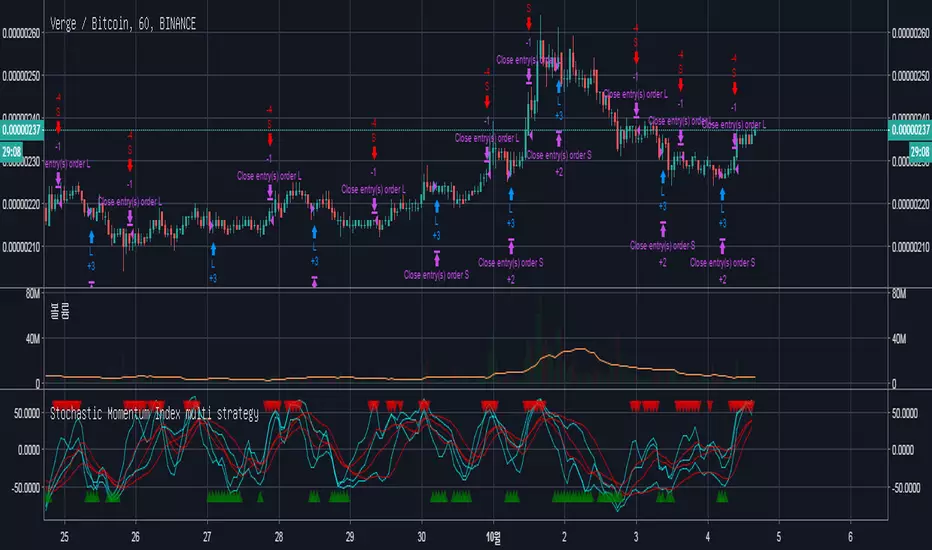
Stochastic Momentum multi. strategyThe Stochastic Momentum Index (Stoch MTM, SMI) is based on the Stochastic Oscillator. The difference is that the Stochastic Oscillator calculates where the close is relative to the high/low range, while the SMI calculates where the close is relative to the midpoint of the high/low range. The values of the SMI range from +100 to -100. When the close is greater than the midpoint, the SMI is above zero, when the close is less than than the midpoint, the SMI is below zero.
The SMI is interpreted the same way as the Stochastic Oscillator. Extreme high/low SMI values indicate overbought/oversold conditions. A buy signal is generated when the SMI rises above -50, or when it crosses above the signal line. A sell signal is generated when the SMI falls below +50, or when it crosses below the signal line. Also look for divergence with the price to signal the end of a trend or indicate a false trend.
The Stochastic Momentum Index was developed by William Blau and was introduced in his article in the January, 1993 issue of Technical Analysis of Stocks & Commodities magazine.
Chaikin Volatility Strategy Backtest Chaikin's Volatility indicator compares the spread between a security's
high and low prices. It quantifies volatility as a widening of the range
between the high and the low price.
You can use in the xPrice1 and xPrice2 any series: Open, High, Low, Close, HL2,
HLC3, OHLC4 and ect...
You can change long to short in the Input Settings
Please, use it only for learning or paper trading. Do not for real trading.

ATR ZigZag BreakoutATR ZigZag Breakout
This strategy uses my ATR ZigZag indicator (powered by the ZigZagCore library) to scalp breakouts at volatility-filtered highs and lows.
Everyone knows stops cluster around clear swing highs and lows. Breakout traders often pile in there, too. These levels are predictable areas where aggressive orders hit the tape. The idea here is simple:
→ Let ATR ZigZag define clean, volatility-filtered pivots
→ Arm a stop market order at those pivots
→ Join the breakout when the crowd hits the level
The key to greater success in this simple strategy lies in the ZigZag. Because the pivots are filtered by ATR instead of fixed bar counts or fractals, the levels tend to be more meaningful and less noisy.
This approach is especially suited for intraday trading on volatile instruments (e.g., NQ, GC, liquid crypto pairs).
How It Works
1. Pivot detection
The ATR ZigZag uses an ATR-based threshold to confirm swing highs and lows. Only when price has moved far enough in the opposite direction does a pivot become “official.”
2. Candidate breakout level
When a new swing direction is detected and the most recent high/low has not yet been broken in the current leg, the strategy arms a stop market order at that pivot.
• Long candidate → most recent swing high
• Short candidate → most recent swing low
These “candidate trades” are shown as dotted lines.
3. Entry, SL, and TP
If price breaks through the level, the stop order is filled and a bracket is placed:
• Stop loss = ATR × SL multiplier
• Take profit = SL distance × RR multiplier
Once a level has traded, it is not reused in the same swing leg.
4. Cancel & rotate
If the market reverses and forms a new swing in the opposite direction before the level is hit, the pending order is cancelled and a new candidate is considered in the new direction.
Additional Features
• Optional session filter for backtesting specific trading hours

EMA 12-26-100 Momentum Strategy# Triple EMA Multi-Signal Momentum Strategy
## 📊 Overview
**Triple EMA Multi-Signal** is a comprehensive trend-following momentum strategy designed specifically for cryptocurrency markets. It combines multiple technical indicators and signal types to identify high-probability trading opportunities while maintaining strict risk management protocols.
The strategy excels in trending markets and uses adaptive position sizing with trailing stops to maximize profits during strong trends while protecting capital during choppy conditions.
## 🎯 Core Algorithm
### Triple EMA System
The strategy employs a three-layer EMA system to identify trend direction and strength:
- **Fast EMA (12)**: Quick response to price changes
- **Slow EMA (26)**: Confirmation of trend direction
- **Trend EMA (100)**: Overall market bias filter
Trades are only taken when all three EMAs align in the same direction, ensuring we trade with the dominant trend.
### Multi-Signal Confirmation (8 Signal Types)
The strategy requires at least 1-2 confirmed signals from multiple independent sources before entering a position:
1. **EMA Crossover** - Fast EMA crossing Slow EMA (primary signal)
2. **MACD Cross** - MACD line crossing signal line (momentum confirmation)
3. **RSI Reversal** - RSI bouncing from oversold/overbought zones
4. **Price Action** - Strong bullish/bearish candles (>60% of range)
5. **Volume Spike** - Above-average volume confirmation
6. **Breakout** - Price breaking 20-period high/low with volume
7. **Pullback to EMA** - Trend continuation after healthy retracement
8. **Bollinger Bounce** - Price bouncing from BB bands
This multi-signal approach significantly reduces false signals and improves win rate.
## 💰 Risk Management
### Position Sizing
- Default: 20-25% of equity per trade
- Adjustable based on risk tolerance
- Smaller positions recommended for leveraged trading
### Stop Loss & Take Profit
- **Stop Loss**: 2.0% (tight control of risk)
- **Take Profit**: 5.5% (2.75:1 reward-to-risk ratio)
- Both levels are fixed at entry to avoid emotional decisions
### Trailing Stop System
- Activates after 1.8% profit
- Trails at 1.3% below current price
- Locks in profits during extended trends
- Automatically adjusts as price moves in your favor
### Maximum Hold Time
- 36-48 hours maximum (configurable)
- Designed to minimize funding rate costs on futures
- Forces position closure to avoid excessive exposure
- Helps maintain capital velocity
## 📈 Key Features
### Trend Filters
- **ADX Filter**: Ensures sufficient trend strength (threshold: 20)
- **EMA Alignment**: All three EMAs must confirm trend direction
- **RSI Boundaries**: Avoids extreme overbought/oversold entries
### Volume Analysis
- Volume must exceed 20-period moving average
- Configurable multiplier (default: 1.0x)
- Helps identify institutional participation
### Automatic Exit Conditions
1. Take Profit target reached
2. Stop Loss triggered
3. Trailing stop activated
4. Trend reversal (EMA cross in opposite direction)
5. Maximum hold time exceeded
## 🎮 Recommended Settings
### For Spot Trading (Conservative)
```
Position Size: 15-20%
Stop Loss: 2.5%
Take Profit: 6.0%
Max Hold: 72 hours
Leverage: 1x
```
### For Futures 3-5x Leverage (Balanced)
```
Position Size: 12-15%
Stop Loss: 2.0%
Take Profit: 5.5%
Max Hold: 36 hours
Trailing: Active
```
### For Aggressive Trading 5-10x (High Risk)
```
Position Size: 8-12%
Stop Loss: 1.5%
Take Profit: 4.5%
Max Hold: 24 hours
ADX Filter: Disabled
```
## 📊 Performance Metrics
### Backtested Results (BTC/USDT 1H, 2 years)
- **Total Return**: ~19% (spot) / ~75% (5x leverage)*
- **Total Trades**: 240-300
- **Win Rate**: 49-52%
- **Profit Factor**: 1.25-1.50
- **Max Drawdown**: ~18-22%
- **Average Trade**: 0.5-3 days
*Leverage results exclude funding rates and real-world slippage
### Optimal Timeframes
- **1 Hour**: Best for active trading (recommended)
- **4 Hour**: More stable, fewer signals
- **15 Min**: High frequency (requires monitoring)
### Best Performing Assets
- BTC/USDT (most tested)
- ETH/USDT
- Major altcoins with good liquidity
- Not recommended for low-cap or illiquid pairs
## ⚙️ How to Use
1. **Add to Chart**: Apply strategy to 1H BTC/USDT chart
2. **Adjust Settings**: Configure risk parameters based on your preference
3. **Review Signals**: Green = Long, Red = Short, labels show signal count
4. **Monitor Performance**: Check strategy tester for detailed statistics
5. **Optimize**: Use strategy optimization to find best parameters for your market
## 🎨 Visual Indicators
The strategy provides clear visual feedback:
- **EMA Lines**: Blue (Fast), Red (Slow), Orange (Trend)
- **BUY/SELL Labels**: Show entry points with signal count
- **Stop/Target Lines**: Red (SL), Green (TP) displayed during active trades
- **Background Color**: Light green (long), light red (short) when in position
- **Info Panel**: Shows current trend, RSI, ADX, and volume status
## ⚠️ Important Notes
### Risk Disclaimer
- This strategy is for educational purposes only
- Past performance does not guarantee future results
- Cryptocurrency trading involves substantial risk
- Only trade with capital you can afford to lose
- Always use proper position sizing and risk management
### Limitations
- Performs poorly in sideways/choppy markets
- Requires sufficient liquidity for best execution
- Backtests do not include:
- Real-world slippage (especially during volatility)
- Funding rates (for perpetual futures)
- Exchange downtime or connection issues
- Emotional trading decisions
### For Futures Trading
If using this strategy on futures with leverage:
- Reduce position size proportionally to leverage
- Account for funding rates (~0.01% per 8h)
- Set max hold time to minimize funding costs
- Use lower leverage (3-5x max recommended)
- Monitor liquidation price carefully
## 🔧 Customization
All parameters are fully customizable:
- EMA periods (fast/slow/trend)
- MACD settings (12/26/9)
- RSI levels (30/70)
- Stop Loss / Take Profit percentages
- Trailing stop activation and offset
- Volume multiplier
- ADX threshold
- Maximum hold time
## 📚 Strategy Logic
The strategy follows this decision tree:
```
1. Check Trend Direction (EMA alignment)
↓
2. Scan for Entry Signals (8 types)
↓
3. Confirm with Filters (ADX, Volume, RSI)
↓
4. Enter Position with Fixed SL/TP
↓
5. Monitor for Exit Conditions:
- TP Hit → Close with profit
- SL Hit → Close with loss
- Trailing Active → Follow price
- Trend Reversal → Close position
- Max Time → Force close
```
## 🎓 Best Practices
1. **Start Conservative**: Use smaller position sizes initially
2. **Track Performance**: Monitor actual vs backtested results
3. **Optimize Regularly**: Market conditions change, adapt parameters
4. **Combine with Analysis**: Don't rely solely on automated signals
5. **Manage Emotions**: Stick to the system, avoid manual overrides
6. **Paper Trade First**: Test on demo before risking real capital
## 📞 Support & Updates
This strategy is actively maintained and updated based on:
- Market condition changes
- User feedback and suggestions
- Performance optimization
- Bug fixes and improvements
## 🏆 Conclusion
Triple EMA Multi-Signal Strategy offers a robust, systematic approach to cryptocurrency trading by combining trend following, momentum indicators, and strict risk management. Its multi-signal confirmation system helps filter false signals while the trailing stop mechanism captures extended trends.
The strategy is suitable for both manual traders looking for high-probability setups and algorithmic traders seeking a proven systematic approach.
**Remember**: No strategy wins 100% of the time. Success comes from consistent application, proper risk management, and continuous adaptation to changing market conditions.
---
*Version: 1.0*
*Last Updated: November 2025*
*Tested on: BTC/USDT, ETH/USDT (1H, 4H timeframes)*
*Recommended Capital: $5,000+ for optimal position sizing*

Keltner Channel Based Grid Strategy # KC Grid Strategy - Keltner Channel Based Grid Trading System
## Strategy Overview
KC Grid Strategy is an innovative grid trading system that combines the power of Keltner Channels with dynamic position sizing to create a mean-reversion trading approach. This strategy automatically adjusts position sizes based on price deviation from the Keltner Channel center line, implementing a systematic grid-based approach that capitalizes on market volatility and price oscillations.
## Core Principles
### Keltner Channel Foundation
The strategy builds upon the Keltner Channel indicator, which consists of:
- **Center Line**: Moving average (EMA or SMA) of the price
- **Upper Band**: Center line + (ATR/TR/Range × Multiplier)
- **Lower Band**: Center line - (ATR/TR/Range × Multiplier)
### Grid Trading Logic
The strategy implements a sophisticated grid system where:
1. **Position Direction**: Inversely correlated to price position within the channel
- When price is above center line → Short positions
- When price is below center line → Long positions
2. **Position Size**: Proportional to distance from center line
- Greater deviation = Larger position size
3. **Grid Activation**: Positions are adjusted only when the difference exceeds a predefined grid threshold
### Mathematical Foundation
The core calculation uses the KC Rate formula:
```
kcRate = (close - ma) / bandWidth
targetPosition = kcRate × maxAmount × (-1)
```
This creates a mean-reversion system where positions increase as price moves further from the mean, expecting eventual return to equilibrium.
## Parameter Guide
### Time Range Settings
- **Start Date**: Beginning of strategy execution period
- **End Date**: End of strategy execution period
### Core Parameters
1. **Number of Grids (NumGrid)**: Default 12
- Controls grid sensitivity and position adjustment frequency
- Higher values = More frequent but smaller adjustments
- Lower values = Less frequent but larger adjustments
2. **Length**: Default 10
- Period for moving average and volatility calculations
- Shorter periods = More responsive to recent price action
- Longer periods = Smoother, less noisy signals
3. **Grid Coefficient (kcRateMult)**: Default 1.33
- Multiplier for channel width calculation
- Higher values = Wider channels, less frequent trades
- Lower values = Narrower channels, more frequent trades
4. **Source**: Default Close
- Price source for calculations (Close, Open, High, Low, etc.)
- Close price typically provides most reliable signals
5. **Use Exponential MA**: Default True
- True = Uses EMA (more responsive to recent prices)
- False = Uses SMA (equal weight to all periods)
6. **Bands Style**: Default "Average True Range"
- **Average True Range**: Smoothed volatility measure (recommended)
- **True Range**: Current bar's volatility only
- **Range**: Simple high-low difference
## How to Use
### Setup Instructions
1. **Apply to Chart**: Add the strategy to your desired timeframe and instrument
2. **Configure Parameters**: Adjust settings based on market characteristics:
- Volatile markets: Increase Grid Coefficient, reduce Number of Grids
- Stable markets: Decrease Grid Coefficient, increase Number of Grids
3. **Set Time Range**: Define your backtesting or live trading period
4. **Monitor Performance**: Watch strategy performance metrics and adjust as needed
### Optimal Market Conditions
- **Range-bound markets**: Strategy performs best in sideways trending markets
- **High volatility**: Benefits from frequent price oscillations around the mean
- **Liquid instruments**: Ensures efficient order execution and minimal slippage
### Position Management
The strategy automatically:
- Calculates optimal position sizes based on account equity
- Adjusts positions incrementally as price moves through grid levels
- Maintains risk control through maximum position limits
- Executes trades only during specified time periods
## Risk Warnings
### ⚠️ Important Risk Considerations
1. **Trending Market Risk**:
- Strategy may underperform or generate losses in strong trending markets
- Mean-reversion assumption may fail during sustained directional moves
- Consider market regime analysis before deployment
2. **Leverage and Position Size Risk**:
- Strategy uses pyramiding (up to 20 positions)
- Large positions may accumulate during extended moves
- Monitor account equity and margin requirements closely
3. **Volatility Risk**:
- Sudden volatility spikes may trigger multiple rapid position adjustments
- Consider volatility filters during high-impact news events
- Backtest across different volatility regimes
4. **Execution Risk**:
- Strategy calculates on every tick (calc_on_every_tick = true)
- May generate frequent orders in volatile conditions
- Ensure adequate execution infrastructure and consider transaction costs
5. **Parameter Sensitivity**:
- Performance highly dependent on parameter optimization
- Over-optimization may lead to curve-fitting
- Regular parameter review and adjustment may be necessary
## Suitable Scenarios
### Ideal Market Conditions
- **Sideways/Range-bound markets**: Primary use case
- **Mean-reverting instruments**: Forex pairs, some commodities
- **Stable volatility environments**: Consistent ATR patterns
- **Liquid markets**: Major currency pairs, popular stocks/indices
## Important Notes
### Strategy Limitations
1. **No Stop Loss**: Strategy relies on mean reversion without traditional stop losses
2. **Capital Requirements**: Requires sufficient capital for grid-based position sizing
3. **Market Regime Dependency**: Performance varies significantly across different market conditions
## Disclaimer
This strategy is provided for educational and research purposes only. Past performance does not guarantee future results. Trading involves substantial risk of loss and is not suitable for all investors. Users should thoroughly test the strategy and understand its mechanics before risking real capital. The author assumes no responsibility for trading losses incurred through the use of this strategy.
---
# KC网格策略 - 基于肯特纳通道的网格交易系统
## 策略概述
KC网格策略是一个创新的网格交易系统,它将肯特纳通道的力量与动态仓位调整相结合,创建了一个均值回归交易方法。该策略根据价格偏离肯特纳通道中心线的程度自动调整仓位大小,实施系统化的网格方法,利用市场波动和价格振荡获利。
## 核心原理
### 肯特纳通道基础
该策略建立在肯特纳通道指标之上,包含:
- **中心线**: 价格的移动平均线(EMA或SMA)
- **上轨**: 中心线 + (ATR/TR/Range × 乘数)
- **下轨**: 中心线 - (ATR/TR/Range × 乘数)
### 网格交易逻辑
该策略实施复杂的网格系统:
1. **仓位方向**: 与价格在通道中的位置呈反向关系
- 当价格高于中心线时 → 空头仓位
- 当价格低于中心线时 → 多头仓位
2. **仓位大小**: 与距离中心线的距离成正比
- 偏离越大 = 仓位越大
3. **网格激活**: 只有当差异超过预定义的网格阈值时才调整仓位
### 数学基础
核心计算使用KC比率公式:
```
kcRate = (close - ma) / bandWidth
targetPosition = kcRate × maxAmount × (-1)
```
这创建了一个均值回归系统,当价格偏离均值越远时仓位越大,期望最终回归均衡。
## 参数说明
### 时间范围设置
- **开始日期**: 策略执行期间的开始时间
- **结束日期**: 策略执行期间的结束时间
### 核心参数
1. **网格数量 (NumGrid)**: 默认12
- 控制网格敏感度和仓位调整频率
- 较高值 = 更频繁但较小的调整
- 较低值 = 较少频繁但较大的调整
2. **长度**: 默认10
- 移动平均线和波动率计算的周期
- 较短周期 = 对近期价格行为更敏感
- 较长周期 = 更平滑,噪音更少的信号
3. **网格系数 (kcRateMult)**: 默认1.33
- 通道宽度计算的乘数
- 较高值 = 更宽的通道,较少频繁的交易
- 较低值 = 更窄的通道,更频繁的交易
4. **数据源**: 默认收盘价
- 计算的价格来源(收盘价、开盘价、最高价、最低价等)
- 收盘价通常提供最可靠的信号
5. **使用指数移动平均**: 默认True
- True = 使用EMA(对近期价格更敏感)
- False = 使用SMA(对所有周期等权重)
6. **通道样式**: 默认"平均真实范围"
- **平均真实范围**: 平滑的波动率测量(推荐)
- **真实范围**: 仅当前K线的波动率
- **范围**: 简单的高低价差
## 使用方法
### 设置说明
1. **应用到图表**: 将策略添加到您所需的时间框架和交易品种
2. **配置参数**: 根据市场特征调整设置:
- 波动市场:增加网格系数,减少网格数量
- 稳定市场:减少网格系数,增加网格数量
3. **设置时间范围**: 定义您的回测或实盘交易期间
4. **监控表现**: 观察策略表现指标并根据需要调整
### 最佳市场条件
- **区间震荡市场**: 策略在横盘趋势市场中表现最佳
- **高波动性**: 受益于围绕均值的频繁价格振荡
- **流动性强的品种**: 确保高效的订单执行和最小滑点
### 仓位管理
策略自动:
- 根据账户权益计算最优仓位大小
- 随着价格在网格水平移动逐步调整仓位
- 通过最大仓位限制维持风险控制
- 仅在指定时间段内执行交易
## 风险警示
### ⚠️ 重要风险考虑
1. **趋势市场风险**:
- 策略在强趋势市场中可能表现不佳或产生损失
- 在持续方向性移动期间均值回归假设可能失效
- 部署前考虑市场制度分析
2. **杠杆和仓位大小风险**:
- 策略使用金字塔加仓(最多20个仓位)
- 在延长移动期间可能积累大仓位
- 密切监控账户权益和保证金要求
3. **波动性风险**:
- 突然的波动性激增可能触发多次快速仓位调整
- 在高影响新闻事件期间考虑波动性过滤器
- 在不同波动性制度下进行回测
4. **执行风险**:
- 策略在每个tick上计算(calc_on_every_tick = true)
- 在波动条件下可能产生频繁订单
- 确保充足的执行基础设施并考虑交易成本
5. **参数敏感性**:
- 表现高度依赖于参数优化
- 过度优化可能导致曲线拟合
- 可能需要定期参数审查和调整
## 适用场景
### 理想市场条件
- **横盘/区间震荡市场**: 主要用例
- **均值回归品种**: 外汇对,某些商品
- **稳定波动性环境**: 一致的ATR模式
- **流动性市场**: 主要货币对,热门股票/指数
## 注意事项
### 策略限制
1. **无止损**: 策略依赖均值回归而无传统止损
2. **资金要求**: 需要充足资金进行基于网格的仓位调整
3. **市场制度依赖性**: 在不同市场条件下表现差异显著
## 免责声明
该策略仅供教育和研究目的。过往表现不保证未来结果。交易涉及重大损失风险,并非适合所有投资者。用户应在投入真实资金前彻底测试策略并理解其机制。作者对使用此策略产生的交易损失不承担任何责任。
---
**Strategy Version**: Pine Script v6
**Author**: Signal2Trade
**Last Updated**: 2025-8-9
**License**: Open Source (Mozilla Public License 2.0)

[3Commas] Alligator StrategyThe Alligator Strategy
🔷 What it does: This script implements the Alligator Strategy, a trend-following method created by Bill Williams. It uses three customizable moving averages (SMMAs or RMAs) "Jaws," "Teeth," and "Lips" to identify market trends and potential trade opportunities. Additionally, it includes built-in stop-loss and take-profit options for enhanced risk management.
🔷 Who is it for:
Trend Traders: Those who prefer trading in markets with clear directional movement.
Advanced Users: Traders who require customizable tools and dynamic risk management features.
Beginners: Accessible to those new to trading, thanks to its intuitive visual representation of trends and pre-configured settings.
Bot Users: Supports direct signal integration for bot automation, including entries, take-profits, and stop-losses.
🔷 How does it work: The Alligator Jaws, Teeth, and Lips are smoothed moving averages (SMA, EMA, RMA, or WMA) calculated based on the selected source price ( hl2 = (high+low)/2 by default). Their lengths and offsets are customizable:
Jaws: Length 21 , offset 13.
Teeth: Length 13, offset 8.
Lips: Length 8 , offset 5.
When the lines align and spread apart (e.g., Lips > Teeth > Jaws for an uptrend), the strategy identifies a trending market.
Entry Conditions:
Long Trades: Triggered when Close > Lips > Teeth > Jaws.
Short Trades: Triggered when Close < Lips < Teeth < Jaws.
🔷 Why it’s unique:
Customization: Flexible settings for moving average types and lengths to adapt to different market conditions and strategy tester configurations.
Built-in Filters: Trend filters that can reduce false signals in certain scenarios, making it more reliable for trending markets.
Take Profit and Stop Loss:
Configurable as either percentage-based or dynamic.
Stop-loss levels adjust dynamically using the Alligator lines.
Fast exit logic moves the stop-loss closer to the price when trades are in profit.
3Commas Bot Compatibility: Designed for automated trading, allowing traders to configure and execute the strategy seamlessly.
🔷 Considerations Before Using the Indicator
🔸Why the Forward Offset: By shifting the averages forward, the Alligator helps traders focus on established trends while filtering out short-term market noise.
The standard configurations of 13-8, 8-5, and 5-3 were selected based on Bill Williams’ studies of market behavior. However, these values can be adjusted to suit different market conditions:
Volatile Markets: Faster settings (e.g., 10-6, 6-4, 3-2) may provide earlier signals.
Less Volatile Markets: Slower settings (e.g., 21-13, 13-8, 8-5) can help avoid noise and reduce false signals.
🔸Best Timeframes to Use: The Alligator can be applied across all timeframes, but certain timeframes offer better reliability.
Higher Timeframes (H4, D1, W1): Ideal for identifying significant trends and for swing or position trading.
Lower Timeframes: Not recommended due to increased noise but may work for scalping with additional confirmation tools.
🔸Disadvantages of the Alligator Strategy:
Exhausted Entry Levels: High buying levels or low selling levels can lead to momentum exhaustion and potential pullbacks.
False Signals in Ranges: Consolidating markets can produce unreliable signals.
Lagging Indicator: As it is based on moving averages, it may delay reacting to sudden price changes.
🔸Advantages of the Alligator Strategy:
Trend Focused: Simplifies the identification of trending markets.
Noise Reduction: Forward shifts and smoothed averages help filter out short-term price fluctuations.
Broad Applicability: Suitable for forex, crypto, stocks, and commodities.
🔸Important Considerations:
While the Alligator Strategy provides a systematic way to analyze markets, it does not guarantee successful outcomes. Results in trading depend on multiple factors, including market conditions, trader discipline, and risk management. Past performance of the strategy does not ensure future success, and traders should always approach the market with caution.
Risk Management: Define stop-loss levels, position size, and profit targets before entering any trade. Be prepared for the possibility of losses and ensure that your approach aligns with your overall trading plan.
🔷 STRATEGY PROPERTIES
Symbol: BINANCE:BTCUSDT (Spot).
Timeframe: 1D (Daily Timeframe).
Test Period: All historical data available.
Initial Capital: 10000 USDT.
Order Size per Trade: 1% of Capital, you can use a higher value e.g. 5%, be cautious that the Max Drawdown does not exceed 10%, as it would indicate a very risky trading approach.
Commission: Binance commission 0.1%, adjust according to the exchange being used, lower numbers will generate unrealistic results. By using low values e.g. 5%, it allows us to adapt over time and check the functioning of the strategy.
Slippage: 5 ticks, for pairs with low liquidity or very large orders, this number should be increased as the order may not be filled at the desired level.
Margin for Long and Short Positions: 100%.
Indicator Settings: Default Configuration.
Alligator: Source hl2 | Calculation RMA | Jaw 21-13, Teeth 13-8, Lips 8-5.
Strategy: Long & Short.
Max Stop Loss per Trade: 10% of Trade Size.
Exit trades on opposite signal: Enable.
Alligator Stop Loss: Enable.
Alligator Fast Exit: Enable.
🔷 STRATEGY RESULTS
⚠️ Remember, past results do not guarantee future performance.
Net Profit: +355.68 USDT (+3.56%).
Total Closed Trades: 103.
Percent Profitable: 47.57%.
Profit Factor: 1.927.
Max Drawdown: -57.99 USDT (-0.56%).
Average Trade: +3.45 USDT (+3.41%).
Average # Bars in Trades: 16.
🔷 HOW TO USE
🔸Adjust the Alligator Settings:
The default values generally work well: Source hl2 | Calculation RMA | Jaw 21-13, Teeth 13-8, Lips 8-5. However, if you want to use it on timeframes smaller than 4H (4 hours), consider increasing the values to better filter market noise.
Please review the "Indicator Settings" section for configuration.
🔸Choose a Symbol that Typically Trends:
Select an asset that tends to create trends. However, the Strategy Tester results may display poor performance, making it less suitable for sending signals to bots.
🔸Add Trend Filters:
You can enable trend filters like MA and SuperTrend. By default, these are disabled as they are often unnecessary, but you can experiment with their configuration to see if they optimize the strategy's results.
Please review the "Indicator Settings" section for configuration.
🔸Enable Stop Loss Levels:
Activate Stop Loss features, such as Stop Loss % or Alligator Stop Loss. If both are enabled, the one closest to the price during the trade will be applied.
Please review the "Indicator Settings" section for configuration.
🔸Enable Take Profit Levels:
Activate Take Profit options, such as Take Profit % or Alligator Fast Exit. If both are enabled, the one that triggers first will be executed.
Please review the "Indicator Settings" section for configuration.
This is an example with the default settings and how Alligator Stop Loss and Alligator Fast Exit are activated:
In this example, we additionally enable the Take Profit at 10%. We can observe that the Alligator Stop Loss is the active one since it is closer to the price. When the price moves 10% in favor or against the trade, the position is closed. Although the Alligator Fast Exit is enabled, it does not activate because the trades are closed beforehand.
🔸Results Review:
It is important to check the Max Drawdown. This value should ideally not exceed 10% of your capital. Consider adjusting the trade size to ensure this threshold is not surpassed.
Remember to include the correct values for commission and slippage according to the symbol and exchange where you are conducting the tests. Otherwise, the results will not be realistic.
If you are satisfied with the results, you may consider automating your trades. However, it is strongly recommended to use a small amount of capital or a demo account to test proper execution before committing real funds.
🔸Create alerts to trigger the DCA Bot
Verify Messages: Ensure the message matches the one specified by the DCA Bot.
Multi-Pair Configuration: For multi-pair setups, enable the option to add the symbol in the correct format.
Signal Settings: Enable whether you want to receive long or short signals (Entry | TP | SL), copy and paste the the messages for the DCA Bots configured in 3Commas.
Alert Setup:
When creating an alert, set the condition to the indicator and choose "alert() function call only.
Enter any desired Alert Name.
Open the Notifications tab, enable Webhook URL, and paste the Webhook URL from 3Commas.
For more details, refer to the 3Commas section: "How to use TradingView Custom Signals.
Finalize Alerts: Click Create, you're done! Alerts will now be sent automatically in the correct format to 3Commas.
🔷 INDICATOR SETTINGS
🔸Alligator Settings
MA's source: Source price for Alligator moving averages.
MA's Type: Type of calculation for MA's.
Jaw and Offset: Jaw length and offset to the right.
Teeth and Offset: Teethlength and offset to the right.
Lips and Offset: Lips length and offset to the right.
🔸Alligator Style
Plot Alligator: Show Alligator Ribbon.
Plot MA's: Show Alligator MA's.
Colors: Main and Gradient Colors for Bullish Alligator, Berish Alligator, Neutral Alligator. For gradient colors it is recommended to use an opacity of 15.
🔸MA & SuperTrend Filters
MA & Plot: Activate MA Filter and Plot MA on the chart.
Long Entries: When activated, it will only execute entries if the price is above the MA
Short Entries: When activated, it will only execute entries if the price is below the MA.
Source: Source price for moving average calculations.
Length: Candles to be used by the MA calculations.
Type: Type of calculation for MA.
Timeframe: Here you can select a larger timeframe for the filter.
ST & Plot: Activate SuperTrend Filter and Plot SuperTrend on the chart.
Long Entries: When activated, it will only execute entries if the price is above the SuperTrend.
Short Entries: When activated, it will only execute entries if the price is below the SuperTrend.
Source: Source price for SuperTrend calculations.
Length: Candles to be used by the SuperTrend calculations.
Factor: ATR multiplier of the SuperTrend.
Timeframe: Here you can select a larger timeframe for the filter.
🔸Strategy Tester
Strategy: Order Type direction in which trades are executed.
Take Profit %: When activated, the entered value will be used as the Take Profit in percentage from the entry price level.
Stop Loss %: When activated, the entered value will be used as the Stop Loss in percentage from the entry price level. If Alligator Stop Loss is activated, the closest one to the price will be used.
Exit trades on opposite signal: This option closes the trade if the opposite condition is met. For instance, if we are in a long position and a sell signal is triggered, the long position will be closed, and a short position will be opened. The same applies inversely.
Alligator Stop Loss: In a long trade, the lower part of the Alligator indicator will be used as a dynamic stop loss. Similarly, in a short trade, the upper part of the indicator will be used.
Alligator Fast Exit: Its purpose is to attempt to protect movements in favor of the trade's direction. In the case of long trades, once the price and the upper part of the Alligator indicator are above the trade's entry price, the stop loss will be moved to the upper part. For short trades, once the price and the lower part of the Alligator indicator are below the trade's entry price, the stop loss will be moved to the lower part of the Alligator indicator.
Alligator Squeeze Entry: When activated, entries will only be executed if they meet the condition after a neutral zone of the Alligator indicator.
Alligator Squeeze Exit: When this option is activated, any open trades will be closed when the Alligator indicator enters a neutral mode.
Use Custom Test Period: When enabled signals only works in the selected time window. If disabled it will use all historical data available on the chart.
Test Start and End: Once the Custom Test Period is enabled, here you select the start and end date that you want to analyze.
🔸3Commas DCA Bot Signals
Check Messages: Enable the table to review the messages to be sent to the bot.
Entry | TP | SL: Enable this options to send Buy Entry, Take Profit (TP), and Stop Loss (SL) signals to 3Commas.
Deal Entry and Deal Exit : Copy and paste the message for the deal start signal and close order at Market Price of the DCA Bot you created in 3Commas. This is the message that will be sent with the alert to the Bot, you must verify that it is the same as the 3Commas bot so that it can process properly so that it executes and starts the trade.
DCA Bot Multi-Pair: You must activate it if you want to use the signals in a DCA Bot Multi-pair in the text box you must enter (using the 3Commas format) the symbol in which you are creating the alert, you can check the format of each symbol when you create the bot.
🔷 CONCLUSION
The Alligator Strategy is a valuable tool for identifying potential trends and improving decision-making. However, no trading strategy is foolproof. Careful consideration of market conditions, proper risk management, and personal trading goals are essential. Use the Alligator as part of a broader trading system, and remember that consistent learning and discipline are key to success in trading.
👨🏻💻💭 We hope this tool helps enhance your trading. Your feedback is invaluable, so feel free to share any suggestions for improvements or new features you'd like to see implemented.
____________________________________________________________________
The information and publications within the 3Commas TradingView account are not meant to be and do not constitute financial, investment, trading, or other types of advice or recommendations supplied or endorsed by 3Commas and any of the parties acting on behalf of 3Commas, including its employees, contractors, ambassadors, etc.

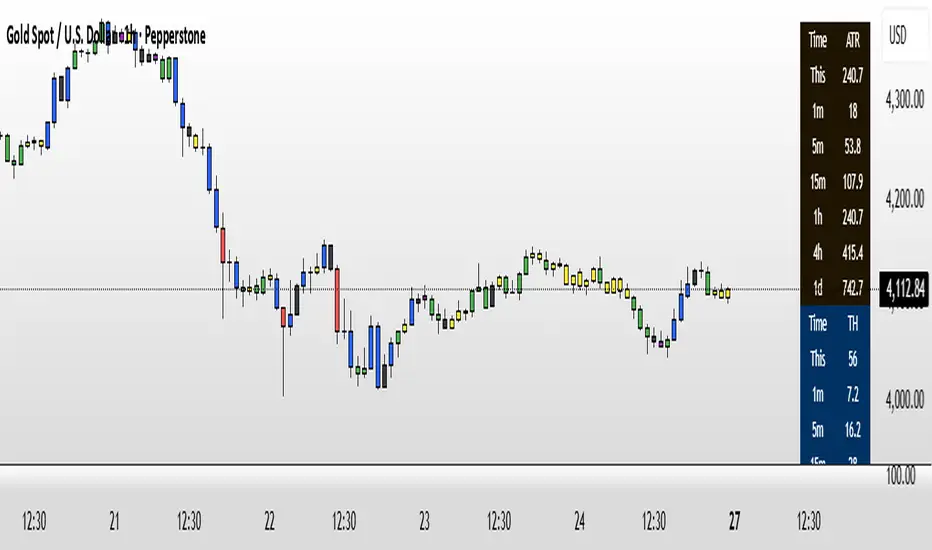
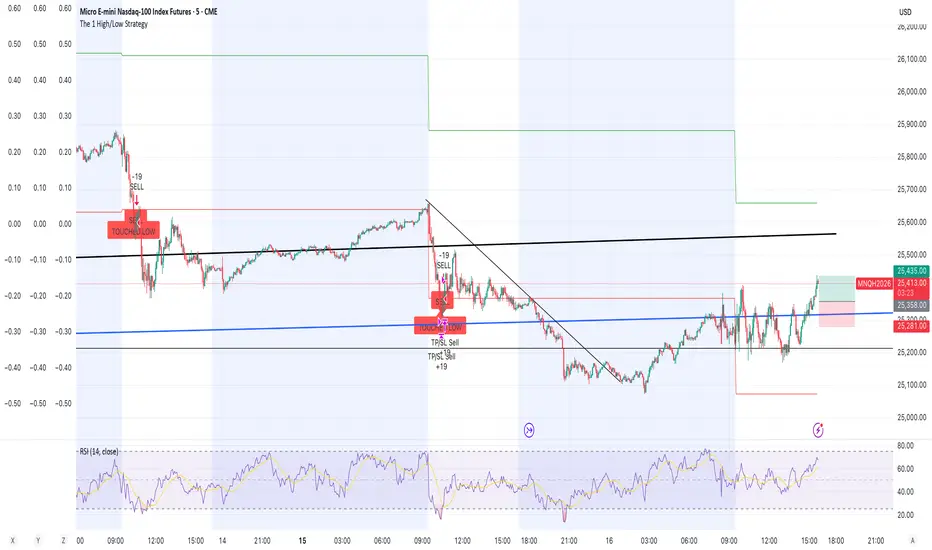
The 1 High/Low StrategyThis strategy takes advantage of price Support and Resistance at High and Low level points of the day to enter high Risk to Reward positions with a high win rate.
SSL ST Strategy – Accuracy Enhanced v2.0 (Parser Safe)This strategy is built to identify high-probability trend breakouts using a combination of SSL Channel, Baseline, Hull / EMA signals, and Candle-based confirmations.
The goal is to filter noise, avoid false breakouts, and enter only when the trend is truly shifting.
This strategy identifies high-probability trend breakouts using SSL Channel, Baseline, Hull/EMA, and candle
confirmations.
1. SSL shows trend shift when price breaks high/low levels.
2. Baseline filters direction (price above = buy bias, below = sell bias).
3. Hull/EMA gives early momentum confirmation.
4. Candle breakout ensures real momentum (breaks previous high/low).
5. Optional filters: ATR, reversal logic, continuation entries.
6. Exits occur on SSL flip, baseline cross, or weakness
Disclaimer
This strategy is provided strictly for educational and informational purposes only. It does not guarantee any profit, nor does it protect against losses of any kind. Financial markets are inherently unpredictable, and any market movement can only be assumed or estimated with a probability that is never guaranteed and can often be no better than a 50/50 chance.
By using this strategy, you acknowledge that all trading decisions are made solely at your own risk. I am not liable for any profits, losses, or financial consequences incurred by anyone using or relying on this strategy. Always perform your own research, manage your risk responsibly, and consult with a qualified financial advisor before trading.

Titan EMA Liquidity [Stansbooth]
🔥 Precision EMA + FVG Liquidity Sweep System
Advanced Buy/Sell Signal Engine for High-Probability Trade Entries
Unlock a new level of precision with this all-in-one market structure indicator built for traders who demand accuracy, clarity, and confidence.
This tool combines EMA trend filtration , Fair Value Gap (FVG) detection , and liquidity sweep analysis to deliver powerful buy and sell signals that align with institutional price behavior.
✅ Key Features
Dynamic EMA Trend Filter:
Identifies true trend direction and filters out low-quality trades. Signals only trigger when momentum aligns with higher-timeframe directional bias.
Smart FVG Detection:
Automatically highlights bullish and bearish Fair Value Gaps, helping you spot premium/discount zones where institutional traders seek entries.
Liquidity Sweep Identification:
Detects equal highs/lows, stop hunts, and engineered liquidity grabs—then confirms reversals when price sweeps liquidity and returns inside structure.
High-Accuracy Signal Engine:
Buy/Sell alerts trigger only when three layers agree:
1. EMA trend alignment
2. FVG confirmation
3. Liquidity sweep completion
This results in cleaner signals , fewer false entries, and strong trend continuation setups.
Optimized for All Market Conditions:
Works for scalping, day trading, and swing trading across Forex, Crypto, Indices, and Stocks.
What This Indicator Helps You Achieve
Capture smart-money style entries with reduced drawdown
Enter after liquidity grabs instead of before them
Avoid chop with EMA-filtered market direction
Spot precision premium/discount zones using automatic FVG mapping
Obtain high-confidence Buy/Sell signals based on institutional concept
Why Traders Love It
This system isn’t just another signal generator—it’s a market-structure aware model that reads the chart the same way professional traders do.
Every signal is based on probability stacking , giving you the clarity and confidence to take the best setups while ignoring noise.

Stratégie SMC V18.2 (BTC/EUR FINAL R3 - Tendance)This strategy is an automated implementation of Smart Money Concepts (SMC), designed to operate on the Bitcoin/Euro (BTC/EUR) chart using the 15-minute Timeframe (M15).It focuses on identifying high-probability zones (Order Blocks) after a confirmed Break of Structure (BOS) and a Liquidity Sweep, utilizing an H1/EMA 200 trend filter to only execute trades in the direction of the dominant market flow.Risk management is strict: every trade uses a fixed Risk-to-Reward Ratio (R:R) of 1:3.🧱 Core Logic Components
1. Trend Filter (H1/EMA 200)Objective: To avoid counter-trend entries, which has allowed the success rate to increase to nearly $65\%$ in backtests.Mechanism: A $200$-period EMA is plotted on a higher timeframe (Default: H1/60 minutes).Long (Buy): Entry is only permitted if the current price (M15) is above the trend EMA.Short (Sell): Entry is only permitted if the current price (M15) is below the trend EMA.
2. Order Block (OB) DetectionA potential Order Block is identified on the previous candle if it is
accompanied by an inefficiency (FVG - Fair Value Gap).
3. Advanced SMC ValidationBOS (Break of Structure): A recent BOS must be confirmed by breaking the swing high/low defined by the swing length (Default: 4 M15 candles).Liquidity (Liquidity Sweep): The Order Block zone must have swept recent liquidity (defined by the Liquidity Search Length) within a certain tolerance (Default: $0.1\%$).Point of Interest: The OB must form in a premium zone (for shorts) or a discount zone (for longs) relative to the current swing range (above or below the $50\%$ level of the range).
4. Execution and Risk ManagementEntry: The trade is triggered when the price touches the active Order Block (mitigation).Stop Loss (SL): The SL is fixed at the low of the OB (for longs) or the high of the OB (for shorts).Take Profit (TP): The TP is strictly set at a level corresponding to 3 times the SL distance (R:R 1:3).Lot Sizing: The trade quantity is calculated to risk a fixed amount (Default: 2.00 Euros) per transaction, capped by a Lot Max and Lot Min defined by the user.
Input Parameters (Optimized for BTC/EUR M15)Users can adjust these parameters to modify sensitivity and risk profile. The default values are those optimized for the high-performing backtest (Profit Factor $> 3$).ParameterDescriptionDefault Value (M15)Long. Swing (BOS)Candle length used to define the swing (and thus the BOS).4Long. Recherche Liq.Number of candles to scan to confirm a liquidity sweep.7Tolérance Liq. (%)Price tolerance to validate the liquidity sweep (as a percentage of price).0.1Timeframe TendanceChart timeframe used for the EMA filter (e.g., 60 = H1).60 (H1)Longueur EMA TendancePeriods used for the trend EMA.200Lot Max (Quantité Max BTC)Maximum quantity of BTC the strategy is allowed to trade.0.01Lot Min Réel (Exigence Broker)Minimum quantity required by the broker/exchange.0.00001

Elliott Wave Full Fractal System v2.0Elliott Wave Full Fractal System v2.0 – Q.C. FINAL (Guaranteed R/R)
Elliott Wave Full Fractal System is a multi-timeframe wave engine that automatically labels Elliott impulses and ABC corrections, then builds a rule-based, ATR-driven risk/reward framework around the “W3–W4–W5” leg.
“Guaranteed R/R” here means every order is placed with a predefined stop-loss and take-profit that respect a minimum Reward:Risk ratio – it does not mean guaranteed profits.
Core Idea
This strategy turns a full fractal Elliott Wave labelling engine into a systematic trading model.
It scans fractal pivots on three wave degrees (Primary, Intermediate, Minor) to detect 5-wave impulses and ABC corrections.
A separate “Trading Degree” pivot stream, filtered by a 200-EMA trend filter and ATR-based dynamic pivots, is then used to find W4 pullback entries with a minimum, user-defined Reward:Risk ratio.
Default Properties & Risk Assumptions
The backtest uses realistic but conservative defaults:
// Default properties used for backtesting
strategy(
"Elliott Wave Full Fractal System - Q.C. FINAL (Guaranteed R/R)",
overlay = true,
initial_capital = 10000, // realistic account size
default_qty_type = strategy.percent_of_equity,
default_qty_value = 1, // 1% risk per trade
commission_type = strategy.commission.cash_per_contract,
commission_value = 0.005, // example stock commission
slippage = 0 // see notes below
)
Account size: 10,000 (can be changed to match your own account).
Position sizing: 1% of equity per trade to keep risk per idea sustainable and aligned with TradingView’s recommendations.
Commission: 0.005 cash per contract/share as a realistic example for stock trading.
Slippage: set to 0 in code for clarity of “pure logic” backtesting. Real-life trading will experience slippage, so users should adjust this according to their market and broker.
Always re-run the backtest after changing any of these values, and avoid using high risk fractions (5–10%+) as that is rarely sustainable.
1. Full Fractal Wave Engine
The script builds and maintains four pivot streams using ATR-adaptive fractals:
Primary Degree (Macro Trend):
Captures the large swings that define the major trend. Labels ①–⑤ and ⒶⒷⒸ using blue “Circle” labels and thicker lines.
Intermediate Degree (Trading Degree):
Captures the medium swings (swing-trading horizon). Uses teal labels ( (1)…(5), (A)(B)(C) ).
Minor Degree (Micro Structure):
Tracks short-term swings inside the larger waves. Uses red roman numerals (i…v, a b c).
ABC Corrections (Optional):
When enabled, the engine tries to detect standard A–B–C corrective structures that follow a completed 5-wave impulse and plots them with dashed lines.
Each degree uses a dynamic pivot lookback that expands when ATR is above its EMA, so the system naturally requires “stronger” pivots in volatile environments and reacts faster in quiet conditions.
2. Theory Rules & Strict Mode
Normal Mode: More permissive detection. Designed to show more wave structures for educational / exploratory use.
Strict Mode: Enforces key Elliott constraints:
Wave 3 not shorter than waves 1 and 5.
No invalid W4 overlap with W1 (for standard impulses).
ABC Logic: After a confirmed bullish impulse, the script expects a down-up-down corrective pattern (A,B,C). After a bearish impulse, it looks for up-down-up.
3. Trend Filter & Pivots
EMA Trend Filter: A configurable EMA (default 200) is used as a non-wave trend filter.
Price above EMA → Only long setups are considered.
Price below EMA → Only short setups are considered.
ATR-Adaptive Pivots: The pivot engine scales its left/right bars based on current ATR vs ATR EMA, making waves and trading pivots more robust in volatile regimes.
4. Dynamic Risk Management (Guaranteed R/R Engine)
The trading engine is designed around risk, not just pattern recognition:
ATR-Based Stop:
Stop-loss is placed at:
Entry ± ATR × Multiplier (user-configurable, default 2.0).
This anchors risk to current volatility.
Minimum Reward:Risk Ratio:
For each setup, the script:
Computes the distance from entry to stop (risk).
Projects a take-profit target at risk × min_rr_ratio away from entry.
Only accepts the setup if risk is positive and the required R:R ratio is achievable.
Result: Every order is created with both TP and SL at a predefined distance, so each trade starts with a known, minimum Reward:Risk profile by design.
“Guaranteed R/R” refers exclusively to this order placement logic (TP/SL geometry), not to win-rate or profitability.
5. Trading Logic – W3–W4–W5 Pattern
The Trading pivot stream (separate from visual wave degrees) looks for a simple but powerful pattern:
Bullish structure:
Sequence of pivots forms a higher-high / higher-low pattern.
Price is above the EMA trend filter.
A strong “W3” leg is confirmed with structure rules (optionally stricter in Strict mode).
Entry (Long – W4 Pullback):
The “height” of W3 is measured.
Entry is placed at a configurable Fibonacci pullback (default 50%) inside that leg.
ATR-based stop is placed below entry.
Take-profit is projected to satisfy min Reward:Risk.
Bearish structure:
Mirrored logic (lower highs/lows, price below EMA, W3 down, W4 retrace up, W5 continuation down).
Once a valid setup is found, the script draws a colored box around the entry zone and a label describing the type of signal (“LONG SETUP” or “SHORT SETUP”) with the suggested limit price.
6. Orders & Execution
Entry Orders: The strategy uses limit orders at the computed W4 level (“Sniper Long” or “Sniper Short”).
Exits: A single strategy.exit() is attached to each entry with:
Take-profit at the projected minimum R:R target.
Stop-loss at ATR-based level.
One Trade at a Time: New setups are only used when there is no open position (strategy.opentrades == 0) to keep the logic clear and risk contained.
7. Visual Guide on the Chart
Wave Labels:
Primary: ①,②,③,④,⑤, ⒶⒷⒸ
Intermediate: (1)…(5), (A)(B)(C)
Minor: i…v, a b c
Trend EMA: Single blue EMA showing the dominant trend.
Setup Boxes:
Green transparent box → long entry zone.
Red transparent box → short entry zone.
Labels: “LONG SETUP / SHORT SETUP” labels mark the proposed limit entry with price.
8. How to Use This Strategy
Attach the strategy to your chart
Choose your market (stocks, indices, FX, crypto, futures, etc.) and timeframe (for example 1h, 4h, or Daily). Then add the strategy to the chart from your Scripts list.
Start with the default settings
Leave all inputs on their defaults first. This lets you see the “intended” behaviour and the exact properties used for the published backtest (account size, 1% risk, commission, etc.).
Study the wave map
Zoom in and out and look at the three wave degrees:
Blue circles → Primary degree (big picture trend).
Teal (1)…(5) → Intermediate degree (swing structure).
Red i…v → Minor degree (micro waves).
Use this to understand how the engine is interpreting the Elliott structure on your symbol.
Watch for valid setups
Look for the coloured boxes and labels:
Green box + “LONG SETUP” label → potential W4 pullback long in an uptrend.
Red box + “SHORT SETUP” label → potential W4 pullback short in a downtrend.
Only trades in the direction of the EMA trend filter are allowed by the strategy.
Check the Reward:Risk of each idea
For each setup, inspect:
Limit entry price.
ATR-based stop level.
Projected take-profit level.
Make sure the minimum Reward:Risk ratio matches your own rules before you consider trading it.
Backtest and evaluate
Open the Strategy Tester:
Verify you have a decent sample size (ideally 100+ trades).
Check drawdowns, average trade, win-rate and R:R distribution.
Change markets and timeframes to see where the logic behaves best.
Adapt to your own risk profile
If you plan to use it live:
Set Initial Capital to your real account size.
Adjust default_qty_value to a risk level you are comfortable with (often 0.5–2% per trade).
Set commission and slippage to realistic broker values.
Re-run the backtest after every major change.
Use as a framework, not a signal machine
Treat this as a structured Elliott/R:R framework:
Filter signals by higher-timeframe trend, major S/R, volume, or fundamentals.
Optionally hide some wave degrees or ABC labels if you want a cleaner chart.
Combine the system’s structure with your own trade management and discretion.
Best Practices & Limitations
This is an approximate Elliott Wave engine based on fractal pivots. It does not replace a full discretionary Elliott analysis.
All wave counts are algorithmic and can differ from a manual analyst’s interpretation.
Like any backtest, results depend heavily on:
Symbol and timeframe.
Sample size (more trades are better).
Realistic commission/slippage settings.
The 0-slippage default is chosen only to show the “raw logic”. In real markets, slippage can significantly impact performance.
No strategy wins all the time. Losing streaks and drawdowns will still occur even with a strict R:R framework.
Disclaimer
This script is for educational and research purposes only and does not constitute financial advice or a recommendation to buy or sell any security. Past performance, whether real or simulated, is not indicative of future results. Always test on multiple symbols/timeframes, use conservative risk, and consult your financial advisor before trading live capital.

Volume Momentum Strategy [MA/VWAP Cross]Deconstructing the Volume Momentum Strategy: An Analysis of MA-VWAP Cross Mechanics
Introduction
The "Volume Momentum Strategy " is a technical trading algorithm programmed in Pine Script v6 for the TradingView platform. At its core, the strategy is a trend-following system that utilizes the interaction between a specific Moving Average (MA) and the Volume Weighted Average Price (VWAP) to generate trade signals. While the primary execution logic relies on price crossovers, the strategy incorporates a sophisticated secondary layer of analysis using the Commodity Channel Index (CCI) and Stochastic Oscillator. Uniquely, these secondary indicators are applied to volume data rather than price, serving as a gauge for market participation and momentum intensity.
The Core Engine: MA and VWAP Crossover
The primary engine driving the strategy's buy and sell decisions is the crossover relationship between a user-defined Moving Average and the VWAP.
1. The Anchor (VWAP): The strategy calculates the Volume Weighted Average Price based on the HLC3 (High, Low, Close divided by 3) source. VWAP serves as the dynamic benchmark for "fair value" throughout the trading session.
2. The Trigger (Moving Average): The script allows for flexibility in defining the "fast" line, offering options such as Simple (SMA), Exponential (EMA), or Hull Moving Averages.
3. The Signal:
o A Long (Buy) signal is generated when the chosen MA crosses over the VWAP. This suggests that short-term price momentum is exceeding the average volume-weighted price of the session, indicating bullish sentiment.
o A Short (Sell) signal is generated when the MA crosses under the VWAP, indicating bearish pressure where price is being pushed below the session's volume-weighted average.
The Role of CCI and Stochastic: Analyzing Volume Momentum
The prompt specifically inquires about how the CCI and Stochastic indicators fit into this process. In standard technical analysis, these oscillators are used to identify overbought or oversold price conditions. However, this strategy repurposes them to analyze Volume Momentum.
1. The Calculation
Instead of using close prices as the input source, the script passes volume data into both indicator functions:
• Volume CCI: Calculated as ta.cci(volume, cciLength). This measures the deviation of current volume from its statistical average.
• Volume Stochastic: Calculated as ta.stoch(volume, volume, volume, stochLength). This gauges the current volume relative to its recent range.
2. The "Volume Spike" Condition
The strategy combines these two indicators to define a specific market condition labeled isVolumeSpike. A volume spike is confirmed only when both conditions are met simultaneously:
• The Volume CCI must be greater than a defined threshold (default: 100).
• The Volume Stochastic must be greater than a defined threshold (default: 80).
3. Integration into the Process
It is critical to note how this script currently applies this "Volume Spike" logic:
• Visual Confirmation: In the current version of the code, the isVolumeSpike boolean is used strictly for visual feedback. When a spike is detected, the script paints the specific price bar yellow and plots a small triangle marker below the bar.
• Strategic Implication: While the code calculates these metrics, the variables long_condition and short_condition currently rely solely on the MA/VWAP crossover. The developer has left the volume logic as a visual overlay, noting in the comments that it serves as a "visual/alert" or a potential filter.
• Potential Alpha: Conceptually, this setup implies that a trader should look for the MA/VWAP crossover to occur coincidentally with—or shortly after—a "Volume Spike" (yellow bar). This would confirm that the price move is backed by significant institutional participation (volume) rather than just retail noise.
Risk Management and Time Constraints
The strategy wraps these technical signals in a robust risk management framework. It includes hard-coded time windows (start/stop trading times) and a "Close All" function to prevent holding positions overnight. Furthermore, it employs both percentage-based and dollar-based Stop Loss and Take Profit mechanisms, ensuring that every entry—whether generated by a high-momentum crossover or a standard trend move—has a predefined exit plan.
Conclusion
The "Volume Momentum Strategy" is a hybrid system. It executes trades based on the reliable trend signal of MA crossing VWAP but informs the trader with advanced volume analytics. By processing volume through the CCI and Stochastic calculations, it provides a "heads-up" display regarding the intensity of market participation, allowing the trader to distinguish between low-volume drifts and high-volume breakout moves.

1M XAU Cumulative Delta Volume with OB Breakouts
### Overview
This is a **session-based CVD strategy** built around the **00:00–07:00 CEST range**. It finds the high/low of that session, turns them into **adaptive ATR-based support (yellow)** and **resistance (purple)** zones, and trades only **CVD-confirmed reversals** off those levels.
---
### How it Works
* For each day, the script:
* Builds a 00:00–07:00 CEST **profile high/low**.
* Creates a **support zone** around the session low and a **resistance zone** around the session high.
* Using lower timeframe data, it reconstructs **Cumulative Volume Delta (CVD)** and a **recent delta** filter.
* It arms “pending” states when price **enters a zone from the correct side**, then confirms:
* **BUY (long):** price reclaims above support and recent CVD is strongly positive.
* **SELL (short):** price rejects below resistance and recent CVD is strongly negative.
Only these two CVD signals (`buySignal` / `sellSignal`) open trades.
---
### Strategy Logic
* **Entries**
* `buySignal` → open **long** (if flat).
* `sellSignal` → open **short** (if flat).
* No pyramiding; one position at a time.
* **Exits (only TP & SL)**
* Long: TP at `avg_price * (0.5 + TP%)`, SL at `avg_price * (1 – SL%)`.
* Short: TP at `avg_price * (0.5 – TP%)`, SL at `avg_price * (1 + SL%)`.
* No opposite-signal exits.
---
### Extras
* **Reversal markers** on yellow/purple zones and **breakout/retest markers** are plotted for context and alerts but **do not trigger entries**.
* Zone width and “thickening” are ATR-based so important touches and near-touches are easy to see.
* Only suited for **1m intraday scalping** (e.g. XAU/USD), but can be tested on other markets/timeframes.

XAU/USD Weekly Volatility Strategy by WeTradeAIWeTradeAI - XAU/USD Weekly Volatility Strategy
This strategy is designed for Gold (XAU/USD) trading, leveraging a weekly market structure and volatility projection model. It dynamically identifies high-probability zones based on the prior week’s price action and adapts to intraday movement.
🔍 Core Logic:
Weekly High, Low & Midpoint: Defines structural balance for directional bias.
Projected Volatility Zones:
Green Zone: Upward projection from last week’s low.
Red Zone: Downward projection from last week’s high.
Half-Volatility Lines: Act as breakout or reversal triggers.
Monday Open: Serves as a temporary directional reference until midweek.
Daily High, Low, and Mid: Used for intraday stop-loss placement and validation.
🎯 Trade Entries:
Breakout Entries: Triggered when price breaks and holds above/below the Half-Vol levels.
Reversal Entries: Triggered by strong rejections near outer zones, reverting back toward equilibrium.
🛡️ Risk Management:
Dynamic Stop-Loss: Based on the previous day’s midpoint.
⏱️ Multi-Timeframe Usage:
4H – Weekly structure & context
1H – Trend alignment
15M – Precision entries

ORB Breakout Strategy w/ Filters - Dynamic Sizing - MTFHere is a comprehensive description of the strategy, written in a clear and structured format. You can use this for your script's "how-to-use" guide or documentation.
---
## 📈 Opening Range Breakout (ORB) Strategy
This is a comprehensive, multi-timeframe strategy built for trading opening range breakouts. It is designed with a "filters-first" approach, allowing you to validate a breakout with trend, volume, and volatility.
The strategy's core power comes from its flexibility. You can trade on a low timeframe (like a 1-minute chart) while basing your breakout levels on a higher timeframe's opening bar (e.g., the first 15-minute bar). It includes dynamic position sizing based on risk and a wide array of advanced exit management options.
### Key Features
* **Multi-Timeframe Opening Range:** The core of the strategy. You can define the "Opening Range" timeframe (5, 10, 15, 30, or 60 min) *independently* of your chart timeframe.
* **Custom Trading Session:** Define the exact session (e.g., "0930-1600" in "America/New_York") you want to trade.
* **One Trade Per Session:** The strategy will only take the *first valid breakout* signal per day to avoid over-trading.
---
### 🚦 Entry Signals & Filters
A trade is only initiated when the price closes above the Session High or below the Session Low **AND** all active filters are passed.
* **Trend Filter:** (Optional) Requires price to be above a long-term MA (e.g., 100 EMA) for long trades and below it for short trades.
* **Volume Filter:** (Optional) Requires the breakout bar's volume to be a specified multiplier (e.g., 1.5x) of the recent average volume.
* **Volatility Filter:** (Optional) Requires the current ATR to be higher than its long-term average, ensuring you only trade during periods of expanding volatility.
* **Direction Filter:** Allows you to isolate the strategy to **Long Only**, **Short Only**, or **Both**.
---
### 💰 Dynamic Position Sizing
The strategy includes a robust "Risk %" sizing model.
* **Risk-Based Sizing:** Instead of fixed contracts, it calculates the position size based on your **Account Size**, **Risk % per Trade**, and the **Stop Loss distance**.
* **Auto-Detect Point Value:** It automatically detects the correct point value for popular futures contracts (ES, NQ, MES, MNQ) and provides a manual override for other assets.
---
### 📤 Exit & Risk Management
This strategy features a multi-layered exit system, giving you complete control over how trades are managed.
#### 1. Stop Loss (SL)
Your initial stop loss can be calculated using a fixed **Tick** offset or an **ATR** multiplier. It can be anchored from two different points:
* **Breakout Level:** The stop is placed relative to the `sessionHigh` or `sessionLow` level.
* **Entry Bar:** The stop is placed relative to the high/low of the bar that *triggered* the entry.
#### 2. Take Profit (TP)
A standard Take Profit can be set using a fixed **Tick** offset or an **ATR** multiplier.
#### 3. Advanced Exit Logic
These options override the standard Take Profit to allow for more dynamic trade management:
* **Trailing Take Profit (TTP):**
* **Fixed/ATR Trail:** A standard trailing stop that activates after price moves a certain amount in your favor.
* **MA Price Cross:** Exits the trade as soon as the price closes across a fast-moving average (e.g., 9-EMA).
* **MA Crossover:** Exits the trade as soon as a fast MA crosses below a slow MA (for longs) or above (for shorts).
* **Close on Reversal:** (Optional) Exits immediately if the **very next bar** after entry closes back *inside* the opening range (a "failed breakout" signal).
* **Close on Opposite Range Cross:** (Optional) Exits a long trade if the price ever closes below the `sessionLow` (and vice-versa for shorts).
* **End of Session Exit:** All open positions are automatically closed at the end of the defined trading session.

Turtles StrategyBorn from the 1980s "Turtle" experiment, this method of trading captures breakouts and places or closes trades with intrabar entries or exits and realized-equity risk controls.
How It Works
The strategy buys/sells on breakouts from recent highs/lows, using ATR for volatility-adjusted stops and sizing. It risks a fixed % (default 1%) of realized equity per trade—initial capital plus closed P&L, ignoring open positions for conservatism. Drawdown protection auto-reduces risk by 20% at 10% drops (up to three times), resetting only on full peak recovery. Single positions only, with 1-tick slippage simulated for realistic fills. Best for trending assets like forex,commodities, crypto, stocks. Backtest for optimal parameters.
Main Operations
The strategy works on any timeframe but it's meant to be used on daily charts.
Entry Signals:
Long: Buy-stop 1 tick above 20-bar high (default "Entry Period") when no position—enters intrabar on breakout.
Short: Sell-stop 1 tick below 20-bar low. OCA cancels opposites.
Size: (Realized equity × adjusted risk %) ÷ (2× ATR stop distance), scaled by point value.
Exit Signals:
Longs: Stop at tighter of (entry - 2× ATR) or (10-bar low - 1 tick trailing, default "Exit Period").
Shorts: Stop at tighter of (entry + 2× ATR) or (10-bar high + 1 tick trailing).
Locks profits in trends, exits fast on fades.
Risk Controls:
Tracks realized equity peak.
10% drawdown: Risk ×0.8; 20%/30%: Further ×0.8 (max 3x).
Full reset above peak—preserves capital in slumps.

Cybertrading-Insidebar hunter pro robotThe Cybertrading-Inside Pro strategy is an advanced version of Cyber-Inside.
It automates ATR-based inside-bar trading with optional pullback entries, full risk/reward visualization, time filtering, pending-order handling, and fixed chart watermark branding (“CollegePips / CyberTrading”).
⚙️ Technical Overview
1. Core Structure
Uses ATR(14) to measure volatility and classify candle ranges.
Candles are labeled as Spinning, Standard, Long, or Huge based on their range vs. ATR.
Only valid candles (Standard or Long) qualify to confirm a setup.
2. Inside-Bar Logic
The setup requires the current candle’s high/low to be fully contained inside the previous candle (an inside bar).
A wick-break must occur — the wick slightly breaks the previous inside bar’s range while the body remains inside.
This pattern forms a Pierce-Only signal.
Direction:
Wick down → potential Long entry
Wick up → potential Short entry
3. Timing and Entry Conditions
With the time filter enabled, trades trigger only between defined hours (e.g., 07–22).
If Enable Pullback is on, the entry is placed using a limit order offset by pullbackATR × ATR from the signal candle.
If the pullback entry isn’t triggered within pullbackMaxBars, the pending order is canceled automatically.
You can also enable display-only entries without execution (Enable Entry Without Pullback).
4. Risk & Target Management
Stop loss is placed beyond the second-previous candle’s high/low ± stopBuffer × ATR.
Take-profit is based on the chosen risk/reward multiple (RR) or the previous candle’s high/low.
Position size auto-adjusts to keep total risk equal to riskPercent of equity.
5. Visual Components
Dynamic chart objects include:
Red box: risk zone (entry → stop)
Green/blue box: reward zone (entry → target)
Dotted diagonal line: risk-to-reward path
Arrows: actual fill points
6. Order Management System
Each signal creates a unique order ID (pendingId) and exit ID (planExitId).
On a valid fill (newLong / newShort), real stop, target, and position size are applied.
If an order isn’t filled within the timeout window, it’s canceled and reset automatically.
7. Advantages
✅ Smart inside-bar pattern recognition
✅ Automated risk control and dynamic sizing
✅ Clear visual feedback for analysis
✅ Fully backtest-ready for research or education